Your restaurant food cost percentage is the cost of the food you actually used in a period, divided by the food sales from that same period. Not what you bought. What you used. Get that one distinction right and most of the bad advice floating around the industry falls apart on its own.
The trouble is that the number is simple to state and easy to get wrong. Operators divide invoices by sales, chase a target someone quoted at a trade show, or celebrate a lower percentage while the bank balance says otherwise. Each of those habits rests on a myth.
Below we take the most common ones in turn, set each against what the numbers actually show, and finish with a table you can pin up next to the office printer.
Key takeaways
- Food cost % = cost of food sold divided by food sales, where cost of food sold = beginning inventory + purchases − ending inventory (with adjustments).
- Industry medians for 2024 sat around 32% of sales for both full-service and limited-service operators, according to the National Restaurant Association.
- Those medians describe what operators spent, not a goal you should hit.
- A lower percentage is not automatically more profit. Dollars of contribution per plate matter as much as the ratio.
- Compare actual cost with your theoretical (recipe) cost every period. The gap is where the money leaks.
Myths about the formula
Myth 1: Food cost is just your purchases divided by your sales
This is the most common shortcut and the most misleading. Purchases tell you what came through the back door this week, not what went out on plates. A big Friday delivery for next week’s banquet can make one period look terrible and the next look brilliant.
Fact: You need inventory counts at both ends of the period. The hospitality management course material published by Penn State sets out the basic version as beginning inventory plus purchases minus ending inventory, then refines it by adding transfers in, subtracting transfers out, and taking out employee meals before you arrive at cost of goods sold.
Here is a worked, clearly hypothetical month for a 60-seat bistro:
- Beginning food inventory: $12,000
- Plus food purchases: $28,000
- Minus ending food inventory: $11,000
- Cost of food sold: $29,000
- Food sales for the month: $90,000
- Food cost percentage: $29,000 ÷ $90,000 = 32.2%
Using purchases alone, the same month would read 31.1%. That gap looks small until you remember it can swing the other way next month, and you will make menu decisions on whichever number you believe. If you want a routine for the counting itself, see our notes on running faster inventory counts.
Myth 2: Food and drink can share one number
Lumping everything together feels tidy, but it hides problems. Bar and kitchen run on very different margins, so a strong beverage month can mask a kitchen that is bleeding.
Fact: The Penn State material calculates food cost percentage, beverage cost percentage and a combined food-and-beverage percentage separately, each against its own sales. Track them apart and only combine them when you need the big picture.
Myths about the benchmarks
Myth 3: Every restaurant should run 28 to 30 percent
You will hear a tidy target quoted with total confidence. Where it comes from is rarely explained, and it ignores your concept, your price point and your menu mix.
Fact: The National Restaurant Association’s 2025 Restaurant Operations Data Abstract, based on more than 900 operators, found that food and non-alcohol beverage costs were a median of 32.0% of sales for full-service respondents and 32.4% for limited-service respondents in 2024. Its earlier editions put the full-service figure around 34% and limited-service around 33%.
The Association is explicit that these figures reflect what operators actually spent, not standards or goals for individual restaurants. The Penn State course notes also reproduce older Association benchmarks for full-service restaurants with average checks under $15 that ranged from 29.8% to 38.0% depending on the quartile. A range that wide is the real lesson: there is no universal correct number.
Myth 4: A lower food cost percentage always means more profit
A lower ratio feels like winning. But a percentage is a ratio, and you bank dollars, not ratios.
Fact: Take two hypothetical mains. A $38 steak with $14 of food cost runs at 36.8% and leaves $24 toward labour, rent and profit. A $19 pasta with $4.50 of food cost runs at 23.7% and leaves $14.50. Push guests from the steak to the pasta and your food cost percentage improves while your contribution per cover falls.
You pay the rent with dollars of contribution, not with a nice-looking percentage.
The Association makes a related point about its own data: lower 2024 ratios did not mean costs fell. Operators mitigated higher costs partly by raising menu prices, streamlining menus and shifting toward off-premises traffic. For more on setting prices with contribution in mind, see our guide to pricing your menu.
Myths about bringing it down
Myth 5: Your actual food cost is the only number you need
Knowing you ran 34% last month tells you something is off. It does not tell you what.
Fact: You need a standard, or theoretical, cost as well. That is what your sales mix should have cost if every dish went out exactly to recipe and portion. Penn State describes comparing the two as an operational efficiency ratio, actual cost divided by standard cost, and notes that a variance of around 10% may be acceptable. The point is less the exact threshold than the habit: a widening gap between theory and reality is the clearest signal you have of waste, over-portioning, unrecorded comps or theft.
Myth 6: Food cost is really a supplier problem
Prices do move, and some lines move hard. The USDA Economic Research Service’s Food Price Outlook, updated in September 2026, forecast wholesale beef prices to rise 8.5% in 2026 and food-away-from-home prices to rise 3.5%.
Fact: Suppliers set the price per case. Your kitchen sets almost everything else: how much is trimmed, how much is binned at close, how heavy the portion scoop is, and how many plates go out without a ticket. Before you reopen price talks, check the in-house list:
- Are recipes costed and current, with portion sizes written down?
- Is waste logged by item at the end of each shift?
- Are staff meals and comps rung in, so they do not disappear into the variance?
- Is receiving checked against the invoice for weight and count?
- Does the kitchen rotate stock first-in, first-out?
Once those are under control, negotiating with suppliers becomes a sharper conversation. Our supplier and purchasing guides cover that side.
Myth vs fact at a glance
| Myth | Fact |
|---|---|
| Food cost = purchases ÷ sales | Use beginning inventory + purchases − ending inventory, adjusted for transfers and staff meals |
| Food and drink share one percentage | Track food, beverage and combined costs separately |
| Everyone should run 28–30% | 2024 industry medians were about 32%, and they describe spending, not targets |
| Lower percentage = more profit | Contribution dollars per plate can fall as the percentage improves |
| Actual cost is all you need | Compare actual with theoretical cost to find the leak |
| It is a supplier problem | Portioning, waste, comps and receiving are in your control |
Food cost questions operators ask
How often should I calculate food cost percentage?
At least monthly, lined up with your accounting period. Many operators count key high-value items weekly so problems show up before month end.
Should employee meals count toward food cost?
Record them, then remove them from cost of food sold and treat them as a staff benefit. That is how the Penn State formula handles them, and it stops staff meals hiding inside the kitchen’s variance.
What is the difference between food cost and prime cost?
Food cost covers only food. Prime cost adds labour, including payroll taxes and benefits, to your cost of goods. Because food and labour are the two biggest controllable costs, many operators watch prime cost weekly alongside food cost.
Is a high food cost percentage always bad?
No. A concept built around premium proteins may run above the median and still make good money if volume and contribution per cover are strong. What matters is whether the number is stable, understood and in line with your plan.
Your next step this week
Pick a day this week and do a full count of food inventory, then do another at the same time next week. Put both counts, the purchases in between and the food sales into the formula above. Then cost out your five best-selling dishes from the recipe cards and compare. That single exercise will tell you more than any benchmark, and it is the foundation for keeping food costs in check month after month.
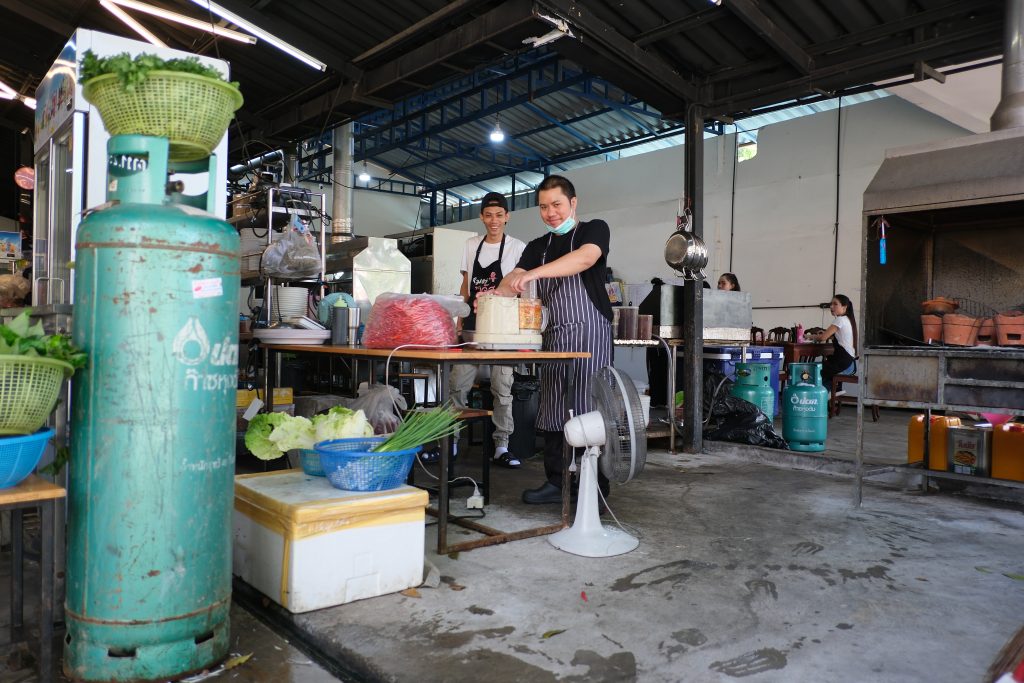
Featured photo: DSCF0806 Two chefs prepare ingredients at a bustling open-air kitchen station surrounded by gas tanks baskets of greens and cooking equipment by PattayaPatrol, BY-SA 4.0.